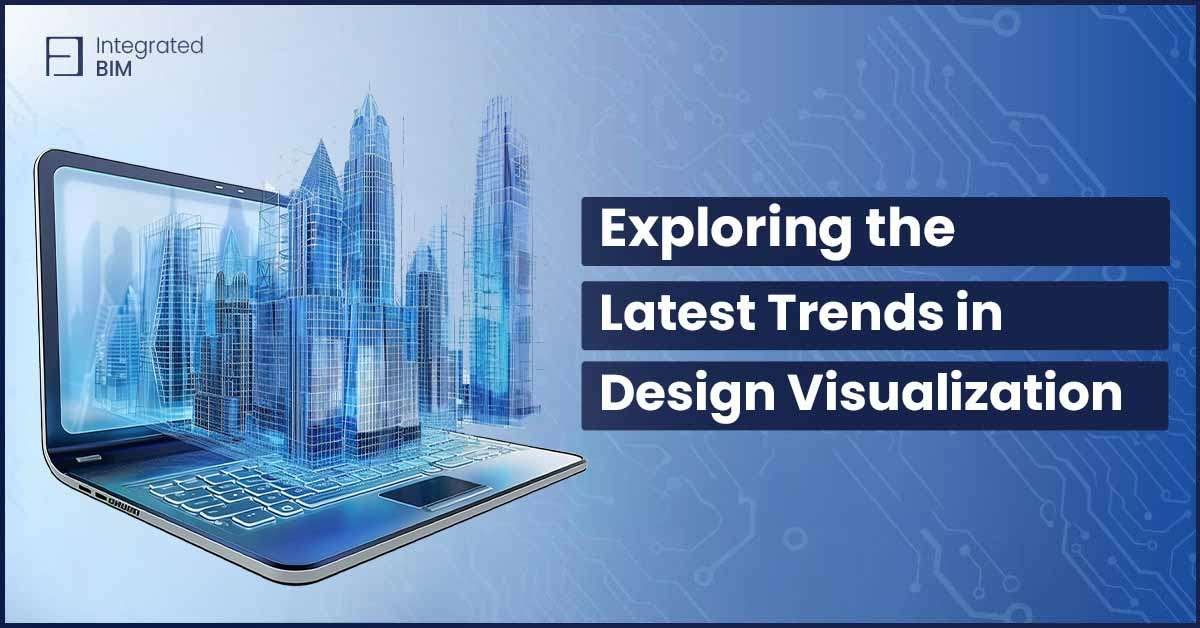
In the constantly changing fields of architecture, construction, and design, visualization technologies are swiftly altering how professionals plan and carry out their projects. Among these, 3D architectural visualizations and data visualization tools stand out as pivotal innovations that are reshaping the industry. The ability to visualize complex data and designs with clarity and precision is no longer a luxury—it’s a necessity. As we look toward the future of data visualization, understanding the latest trends is crucial for staying ahead in a competitive market.
The Rise of 3D Architectural Visualizations
3D architectural visualizations have become a cornerstone in modern design and construction processes. These visualizations allow architects, designers, and clients to see and interact with projects before they’re built, offering a detailed, lifelike representation of structures, interiors, and environments. The power of 3D visualization lies in its ability to bridge the gap between concept and reality, enabling stakeholders to make informed decisions, minimize errors, and improve project outcomes.

One of the most significant trends in 3D architectural visualizations is the increasing use of immersive technologies, such as Virtual Reality (VR) and Augmented Reality (AR). These tools provide an interactive experience where users can explore virtual models of their projects in a fully immersive environment. For instance, at Integrated BIM, we leverage these technologies to create comprehensive visual experiences that allow clients to walk through their projects, view materials, and understand spatial relationships—all before a single brick is laid.
Trends in Data Visualization: Beyond the Basics
Data visualization is a critical aspect of modern business intelligence, and the trends in this field are evolving rapidly. In the context of design and construction, data visualization allows professionals to interpret and present complex data sets in a way that is accessible and actionable. The future of data visualization is leaning heavily towards more intuitive, interactive, and dynamic representations that enhance decision-making processes.
A key trend in data visualization is the move towards real-time analytics. With the integration of Internet of Things (IoT) devices and advanced data collection methods, real-time data feeds are becoming increasingly common in the construction and architecture sectors. These feeds can be visualized through dynamic dashboards, providing stakeholders with up-to-the-minute insights into project progress, resource allocation, and potential risks. This trend not only enhances project management but also improves responsiveness to changes and challenges on the ground.
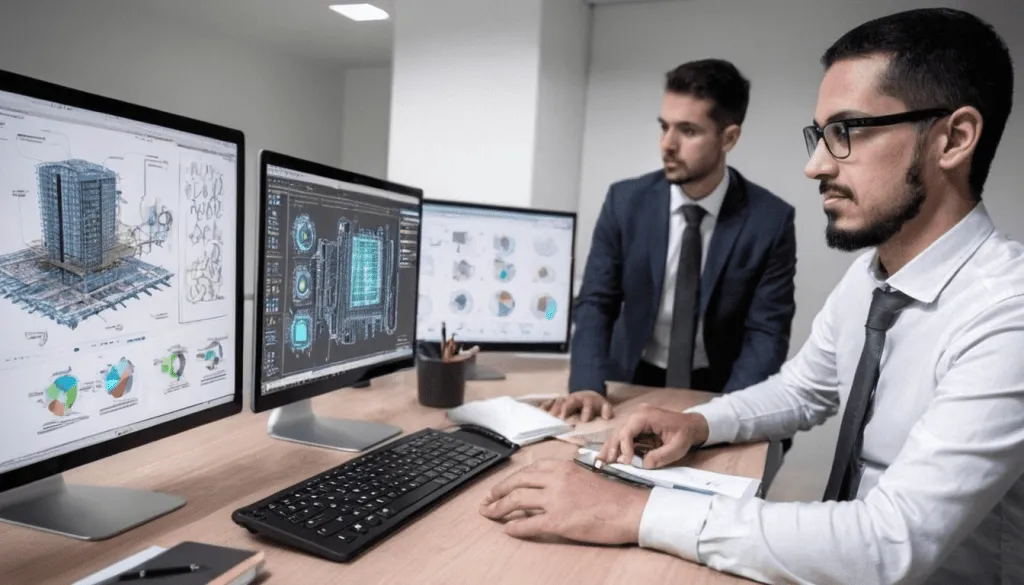
Another significant trend is the use of AI-driven data visualization tools. These tools utilize machine learning algorithms to identify patterns and insights that may not be immediately apparent through traditional analysis methods. By automating the data analysis process, AI-driven visualizations can offer predictive insights, helping businesses anticipate future trends and make proactive decisions.
The Intersection of 3D Visualization and Data Visualization
As both 3D architectural visualizations and data visualization tools continue to advance, the intersection of these technologies is creating new opportunities for innovation. By combining 3D models with dynamic data visualizations, architects and designers can gain deeper insights into how various factors impact their projects.
For example, integrating environmental data with 3D visualizations allows for the creation of more sustainable designs. By visualizing data such as sunlight patterns, wind flow, and temperature variations in conjunction with the 3D model of a building, designers can optimize energy efficiency and create structures that are better suited to their surroundings.
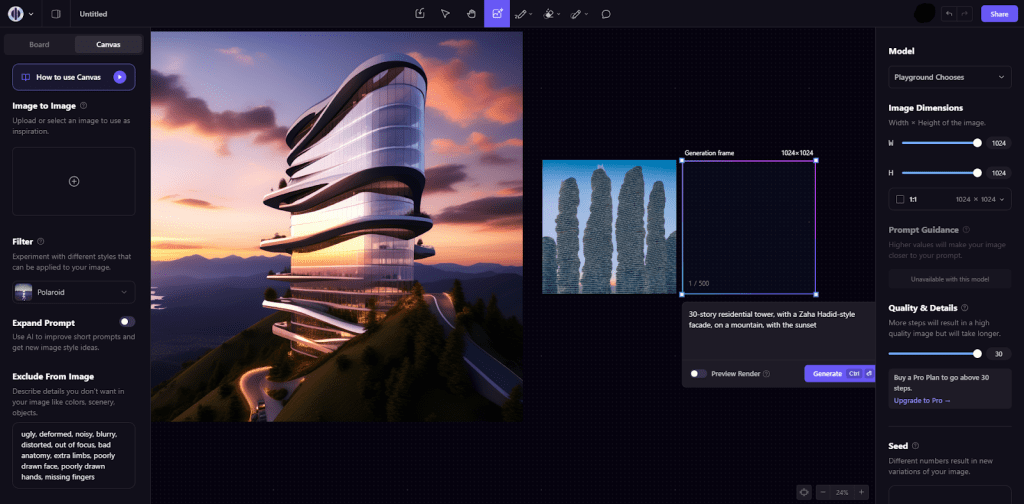
Moreover, the integration of Building Information Modeling (BIM) with data visualization is revolutionizing project management. BIM data can be visualized in real-time, providing a comprehensive view of a project’s life cycle, from planning and design to construction and maintenance. This holistic approach ensures that all stakeholders have access to the same data, reducing the risk of miscommunication and improving collaboration.
Future of Data Visualization in Design
Looking ahead, the future of data visualization in design will be characterized by even greater integration and sophistication. As technologies continue to evolve, we can expect to see more advanced tools that not only present data in visually appealing ways but also allow for deeper interaction and exploration.
One future trend is the development of more personalized and adaptive data visualizations. These tools will be able to adjust the presentation of data based on the user’s preferences, role, and specific needs, making the insights more relevant and actionable. For instance, a project manager might prefer a high-level overview, while an engineer might need a more detailed, technical view of the data.
Another emerging trend is the use of multi-dimensional data visualizations. Moving beyond traditional 2D graphs and charts, these tools will allow users to explore data in 3D or even 4D spaces, providing a more nuanced understanding of complex relationships and trends. This will be particularly valuable in the context of 3D architectural visualizations, where spatial data can be represented in a way that is both intuitive and informative.
Additionally, the rise of cloud-based visualization platforms will make data visualization more accessible and collaborative. These platforms will allow teams to share and interact with visualizations in real-time, regardless of their physical location. This trend will not only improve collaboration but also speed up decision-making processes by ensuring that all stakeholders have access to the latest data and visual insights.
The Importance of Staying Ahead of the Curve
For companies in the design and construction industries, staying ahead of the curve in data visualization trends is essential. The ability to effectively visualize and interpret data can be the difference between a successful project and one that falls short of expectations. By embracing the latest trends in 3D architectural visualizations and data visualization, businesses can enhance their project planning, improve communication with clients, and ultimately deliver higher-quality outcomes.
At Integrated BIM, we are committed to pushing the boundaries of what’s possible in design visualization. By staying at the forefront of these trends, we ensure that our clients have access to the most advanced tools and technologies available. Whether it’s through immersive 3D visualizations, real-time data dashboards, or AI-driven insights, we help our clients turn their visions into reality.

Evolution
The world of design visualization is evolving at a rapid pace, driven by advancements in technology and the increasing demand for more dynamic, interactive, and insightful tools. From the rise of 3D architectural visualizations to the future of data visualization, these trends are not just changing how we see the world—they’re changing how we build it.
As these technologies continue to develop, the potential for innovation in the design and construction industries is immense. By staying informed about the latest trends and investing in the right tools, businesses can position themselves for success in an increasingly competitive landscape.
The future of design visualization is bright, and with the right approach, it can be harnessed to create buildings and spaces that are not only functional and beautiful but also smart, sustainable, and responsive to the needs of the future. For engaging and informative videos, be sure to visit our YouTube channel.
Book a Consultation now!

